I designed a series of data visualizations that help cybersecurity analysts assess and mitigate risks
Role
Product design lead
Responsibilities
Data visualization, interaction design, information architecture, usability testing, onboarding
Given how common and damaging cyberattacks have become, it's now standard practice for corporations to perform cybersecurity audits of their third party vendors. Yet these audits are time-intensive and require a specialized skillset that most mid-sized companies can't afford. To make audits less expensive for companies and prevent vendors from having to perform them time and again, CyberGRX created a way for vendors to document their audits on a shareable platform (what they call a "risk exchange").
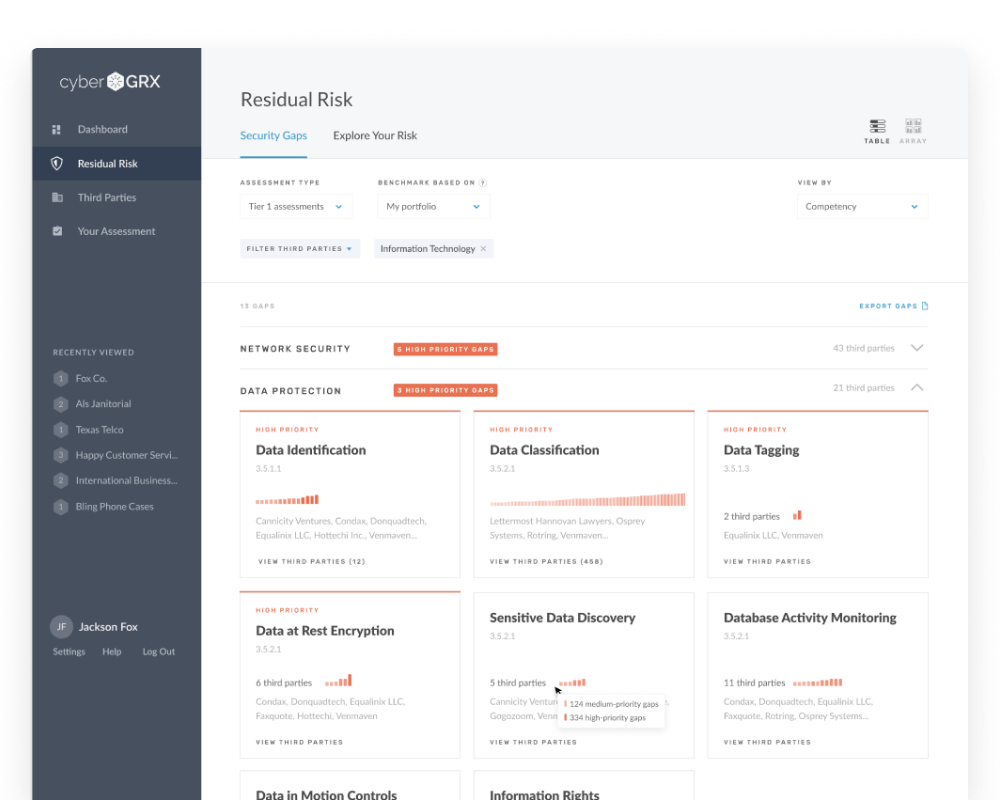
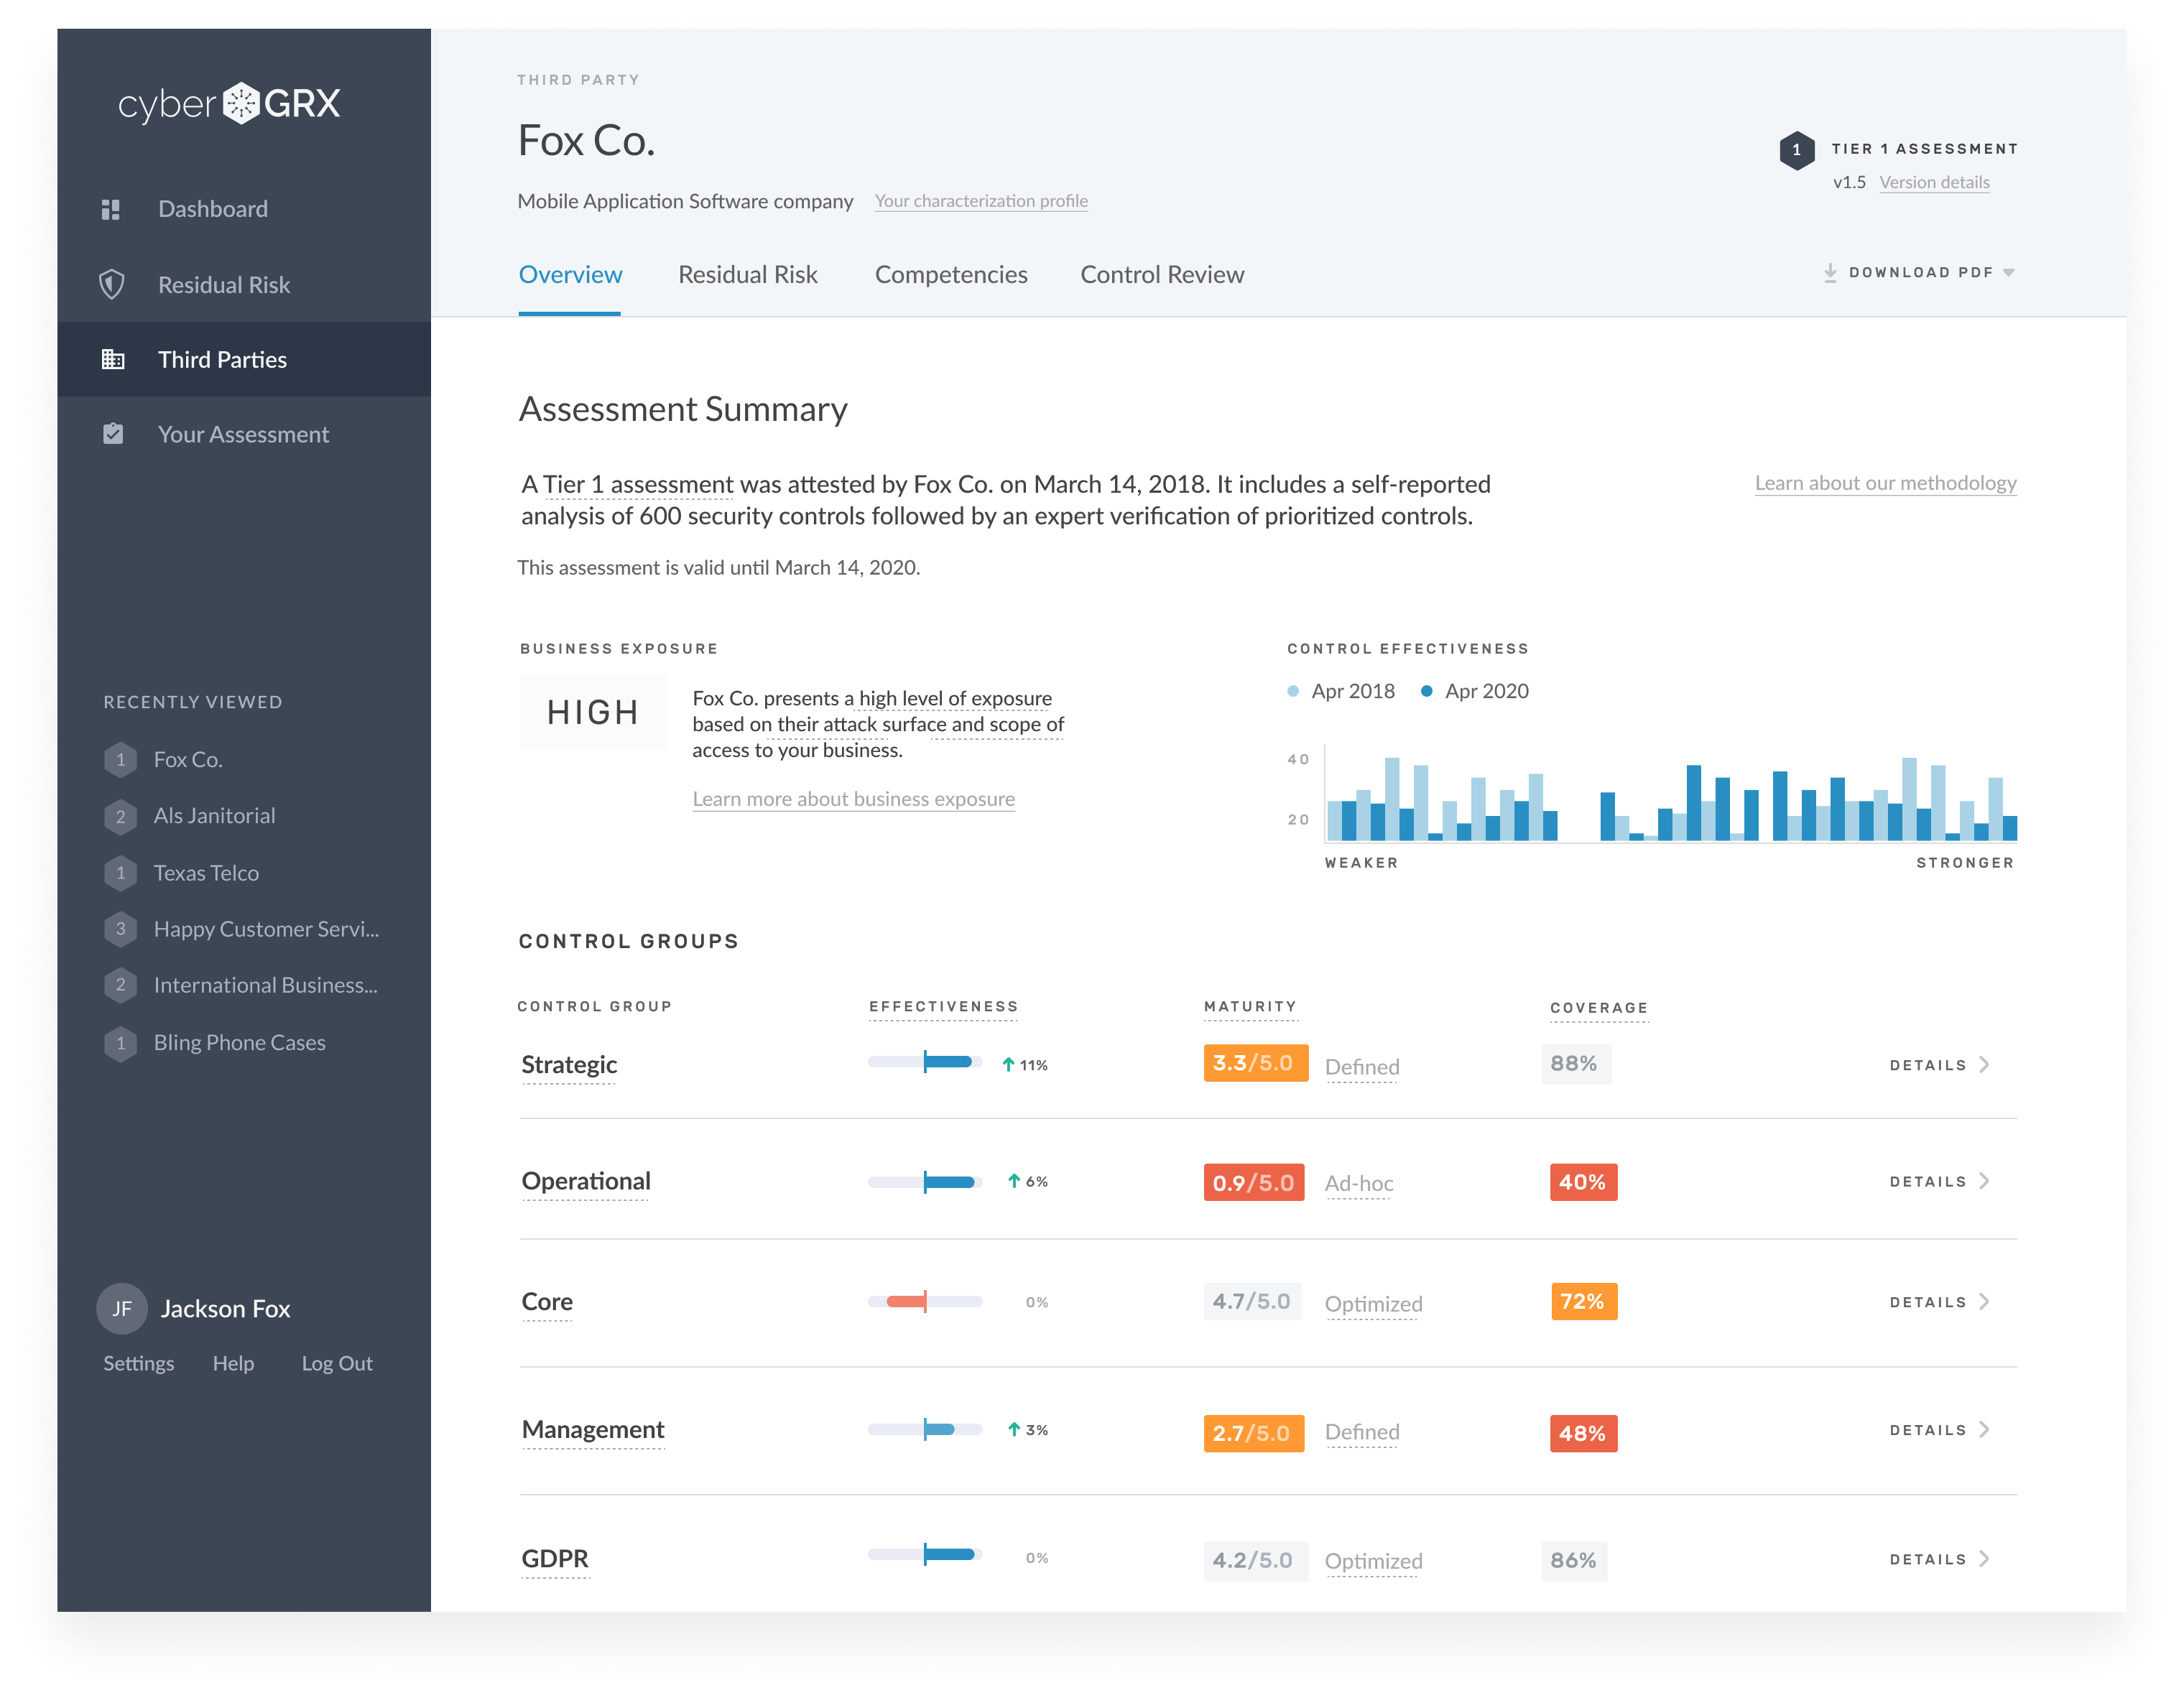
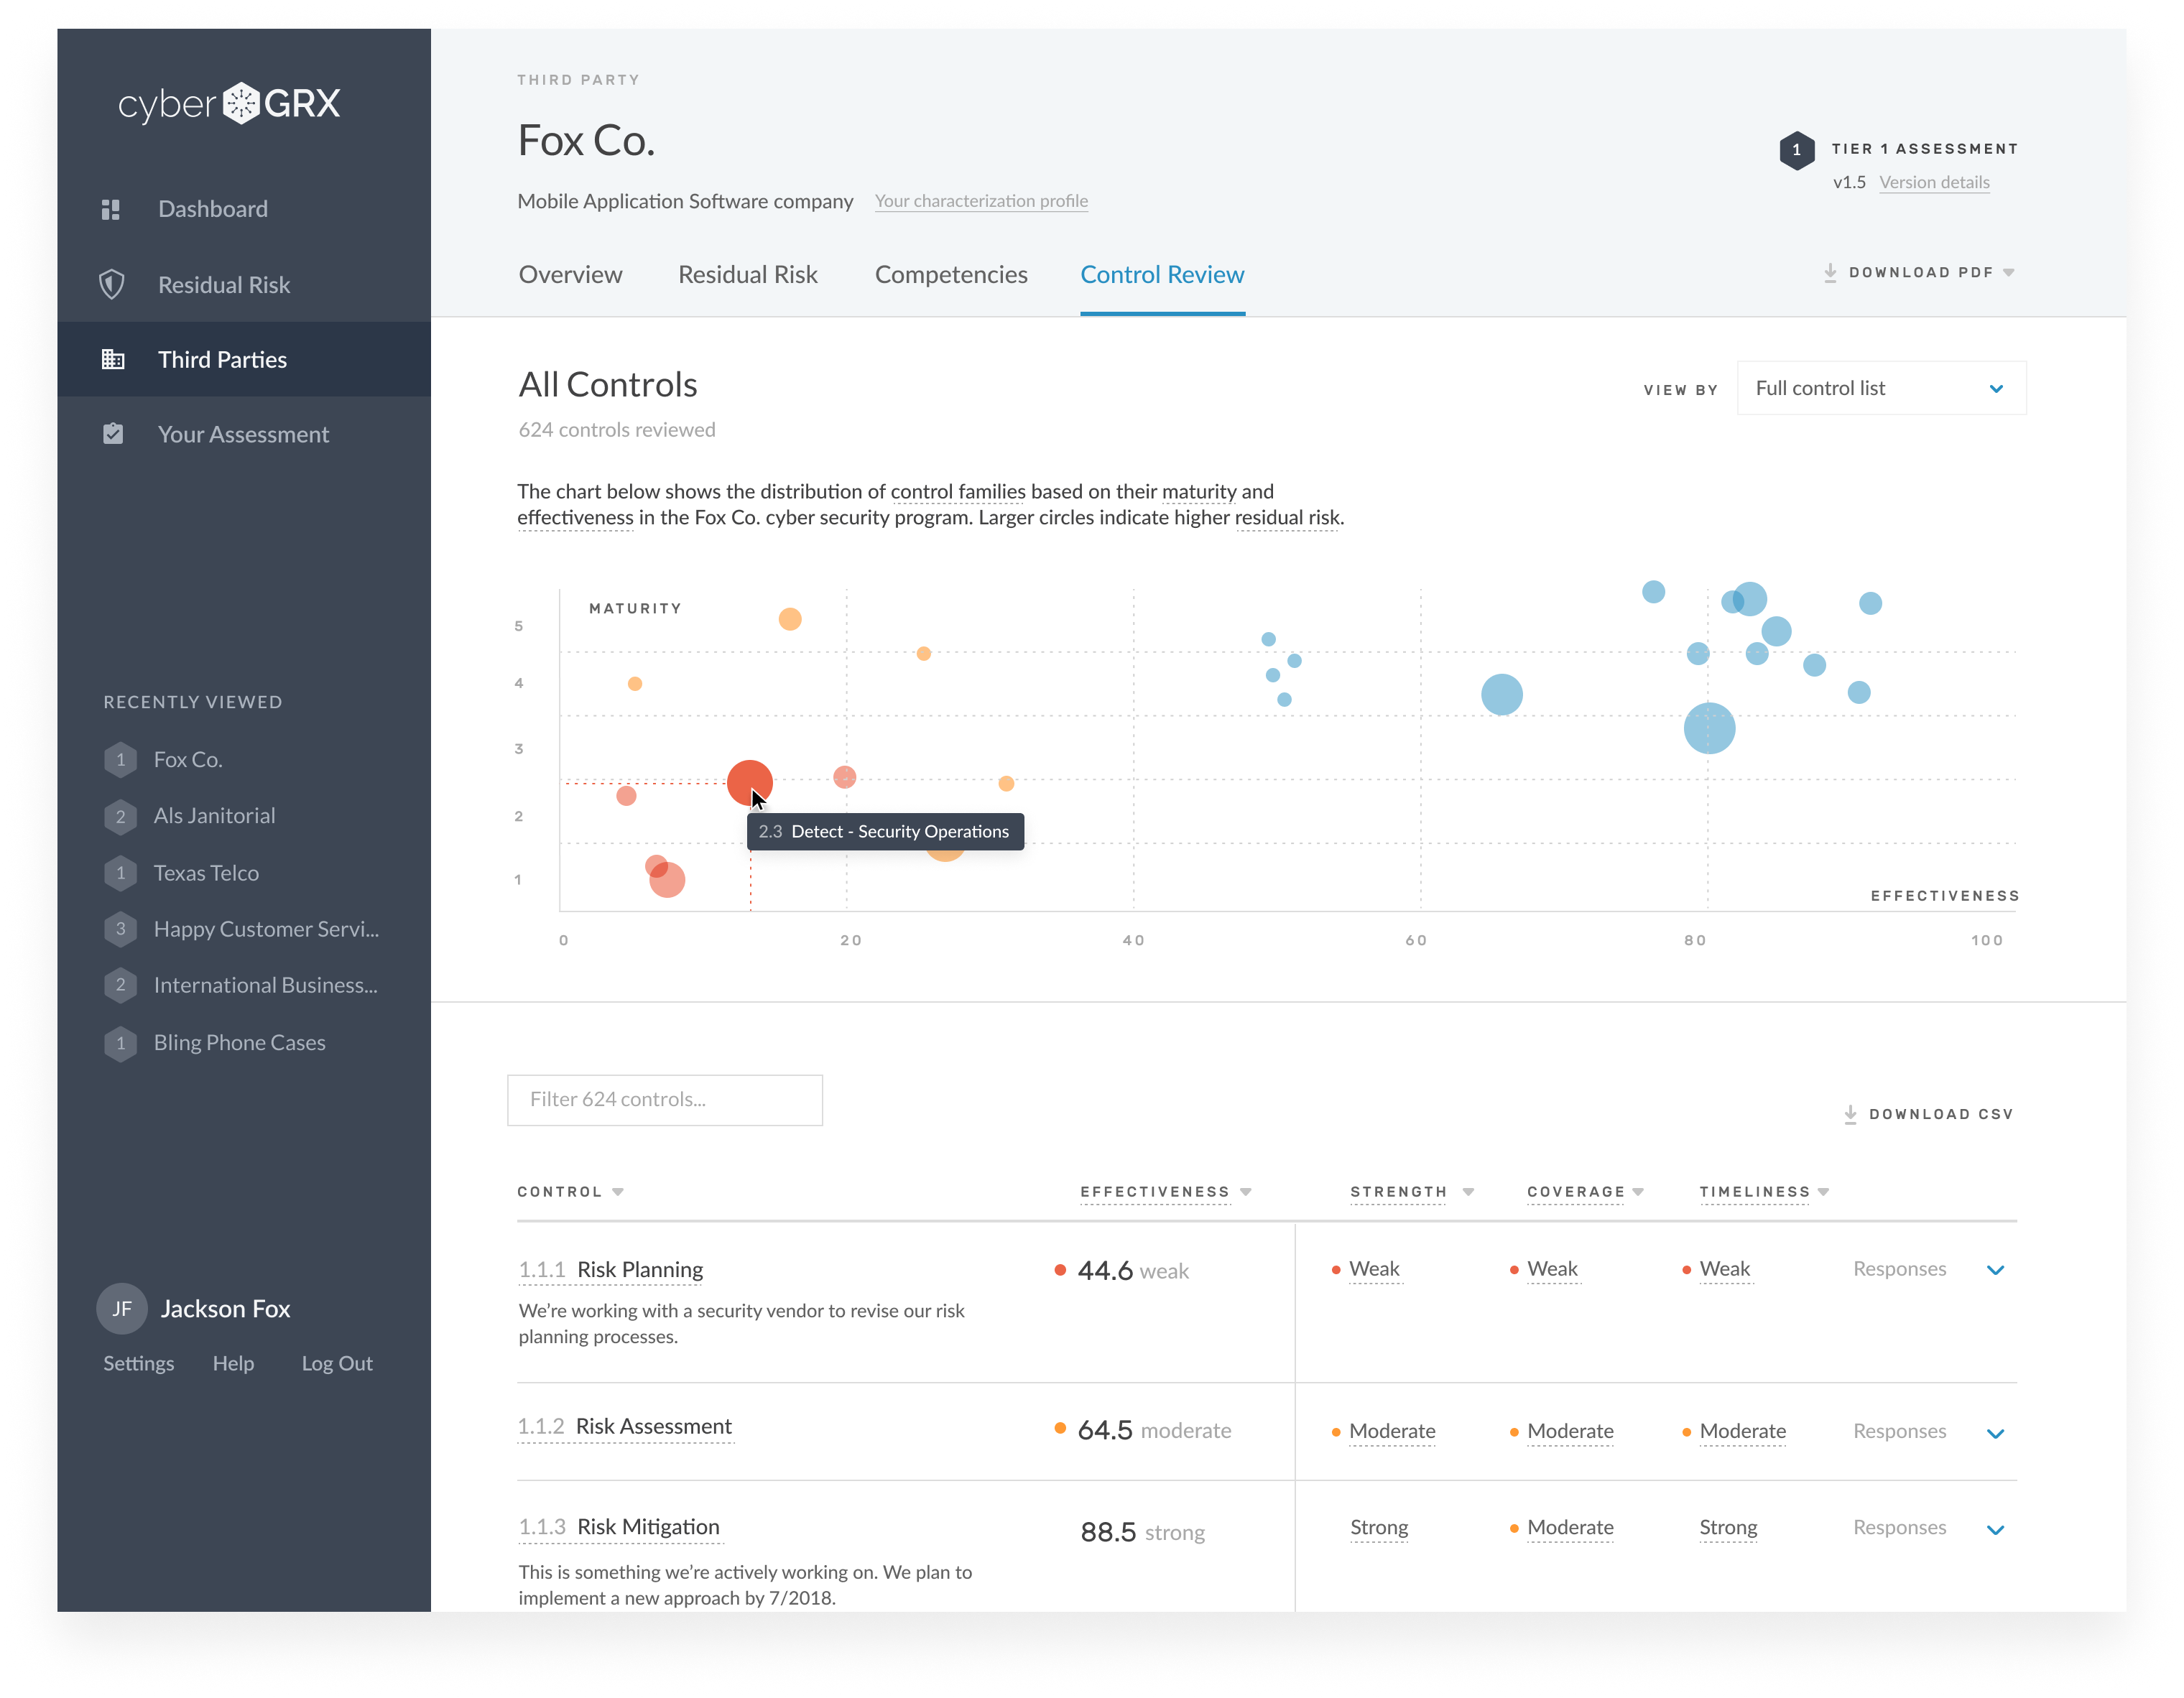
These audits get lengthy and dense, spanning hundreds of data points about potential risks. And when companies might have dozens, if not hundreds of third-party vendors in their portfolio, it becomes nearly impossible to interpret all of their risk data. I worked with CyberGRX to design a set of visualizations that help corporate users make sense of all of this data and determine which risks to prioritize with which vendors.
The Project
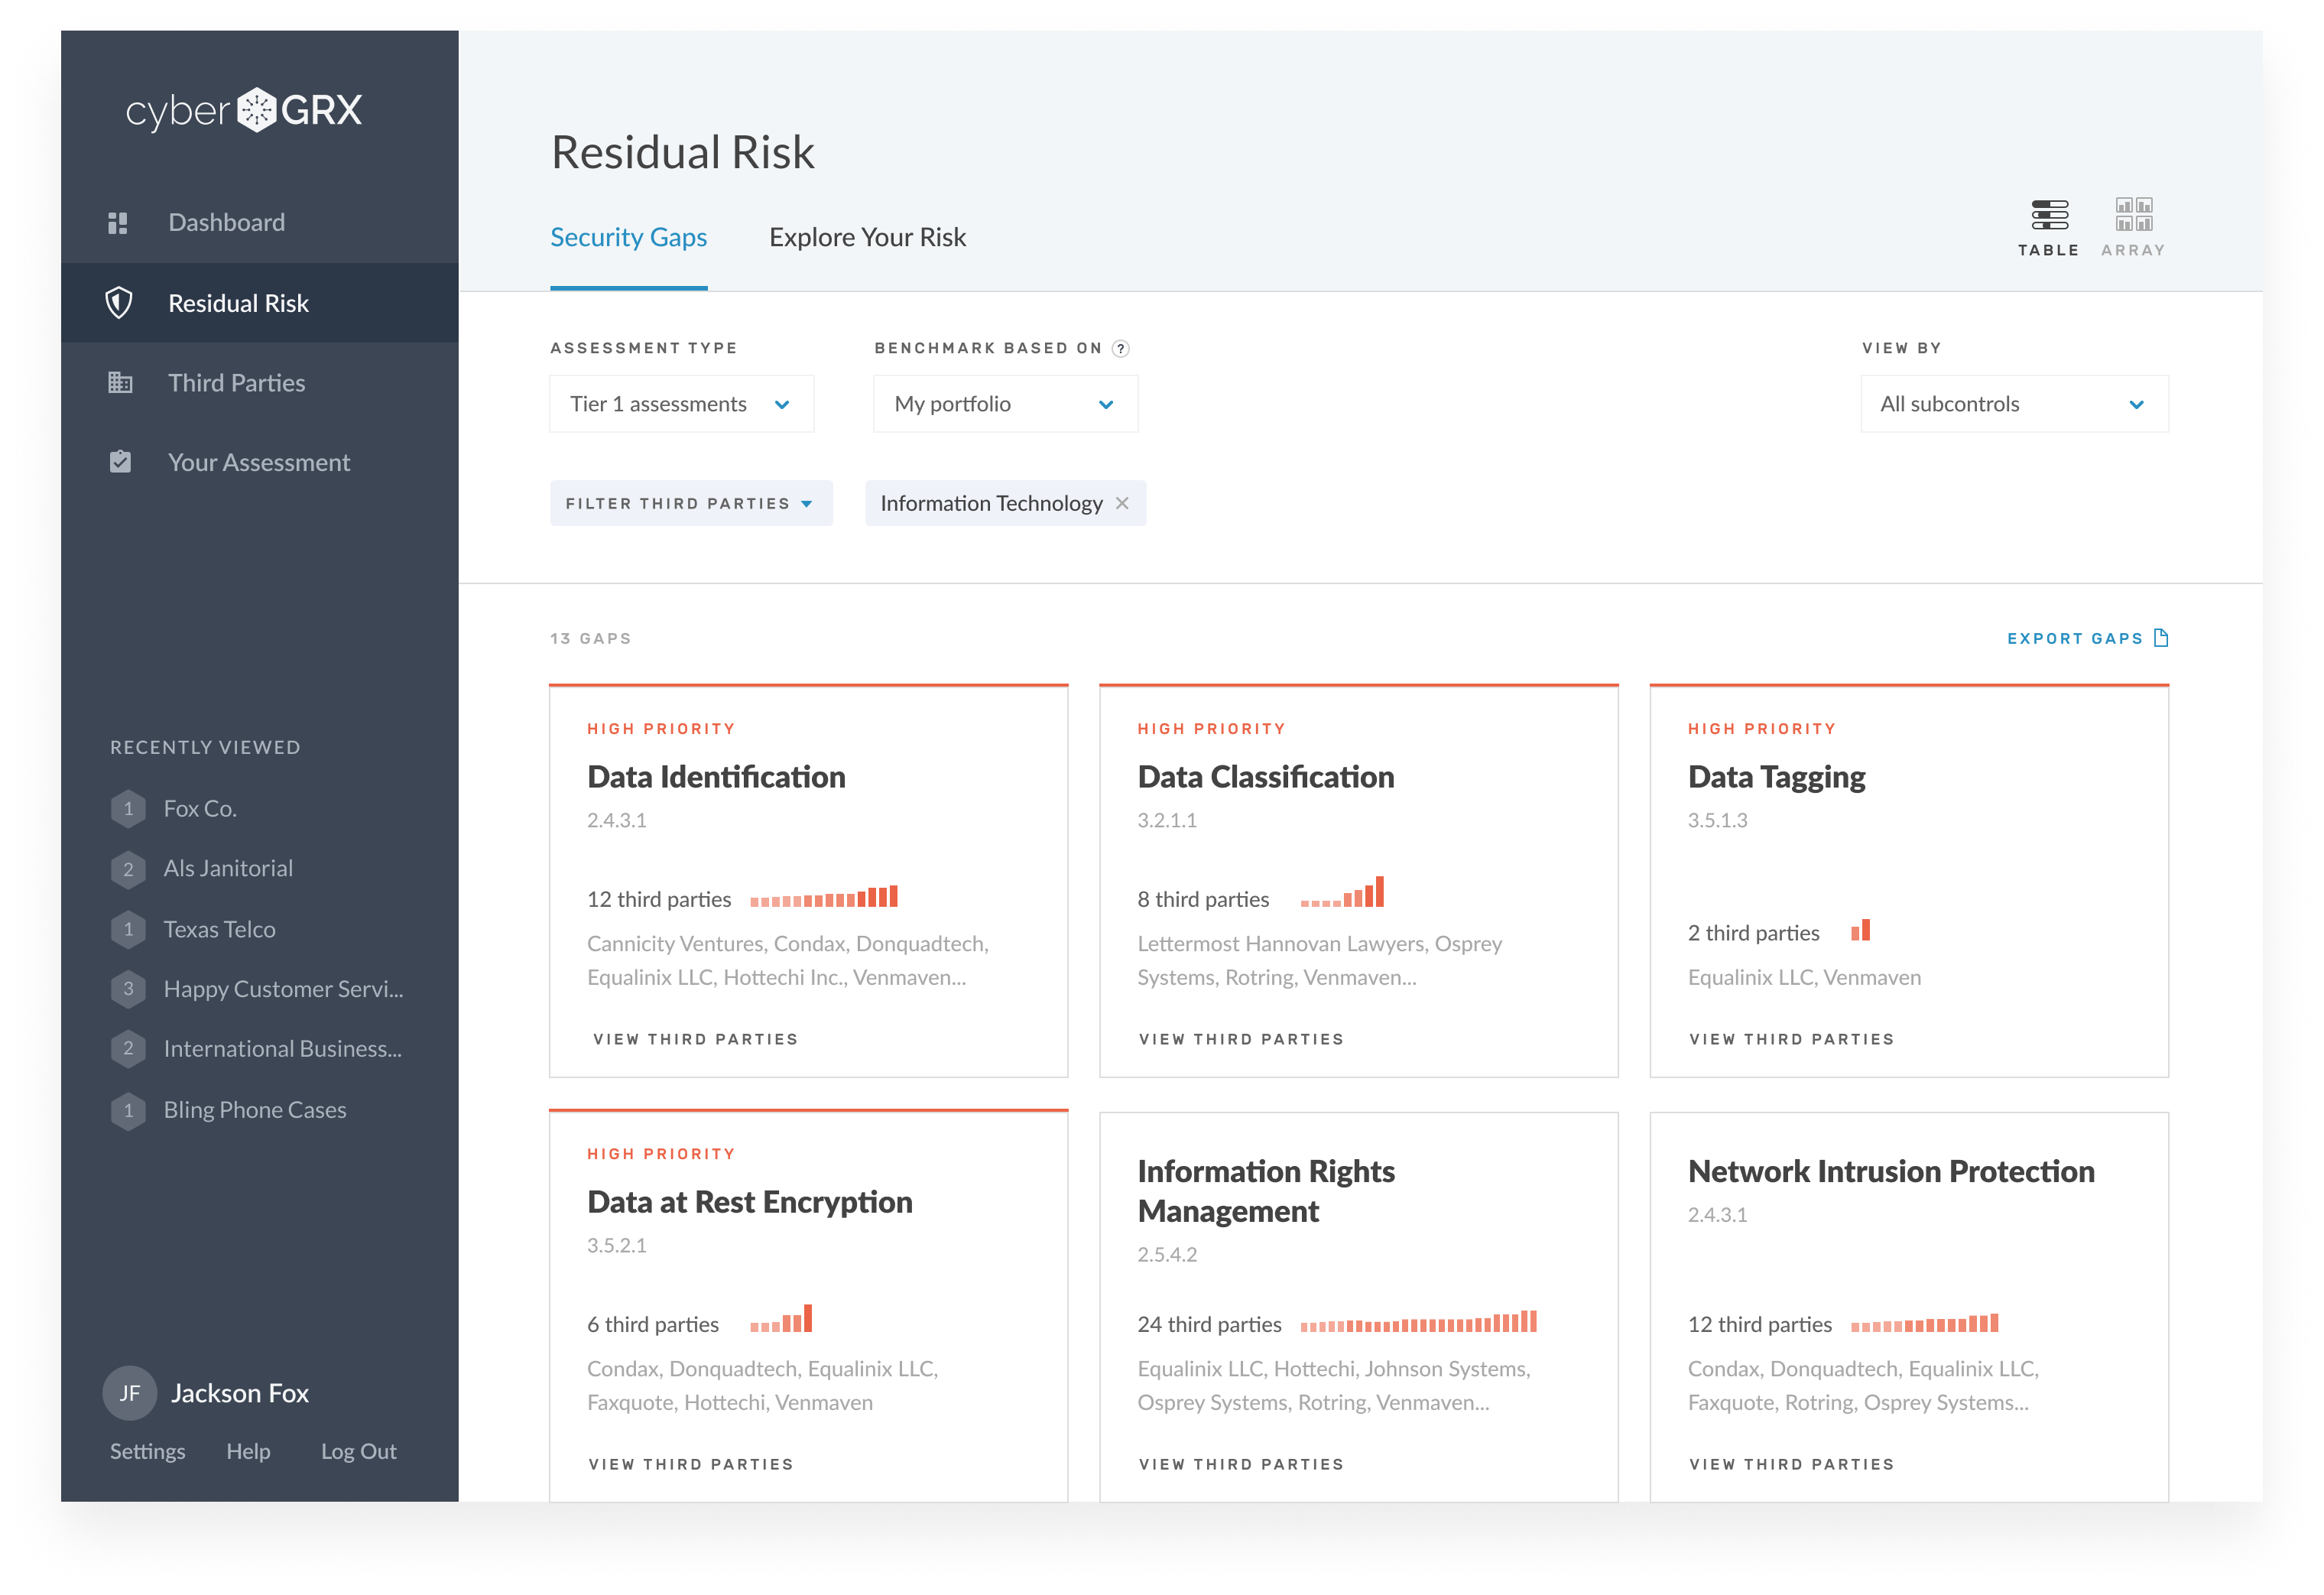
One of CyberGRX's product team's main goals was to help users take a broad look at all of their cybersecurity risk in order to make decisions about what to focus on. To this end, I used their design system as a starting point for designed new navigation and visualization patterns, often drawing on small multiples to help people scan data sets and make comparisons.
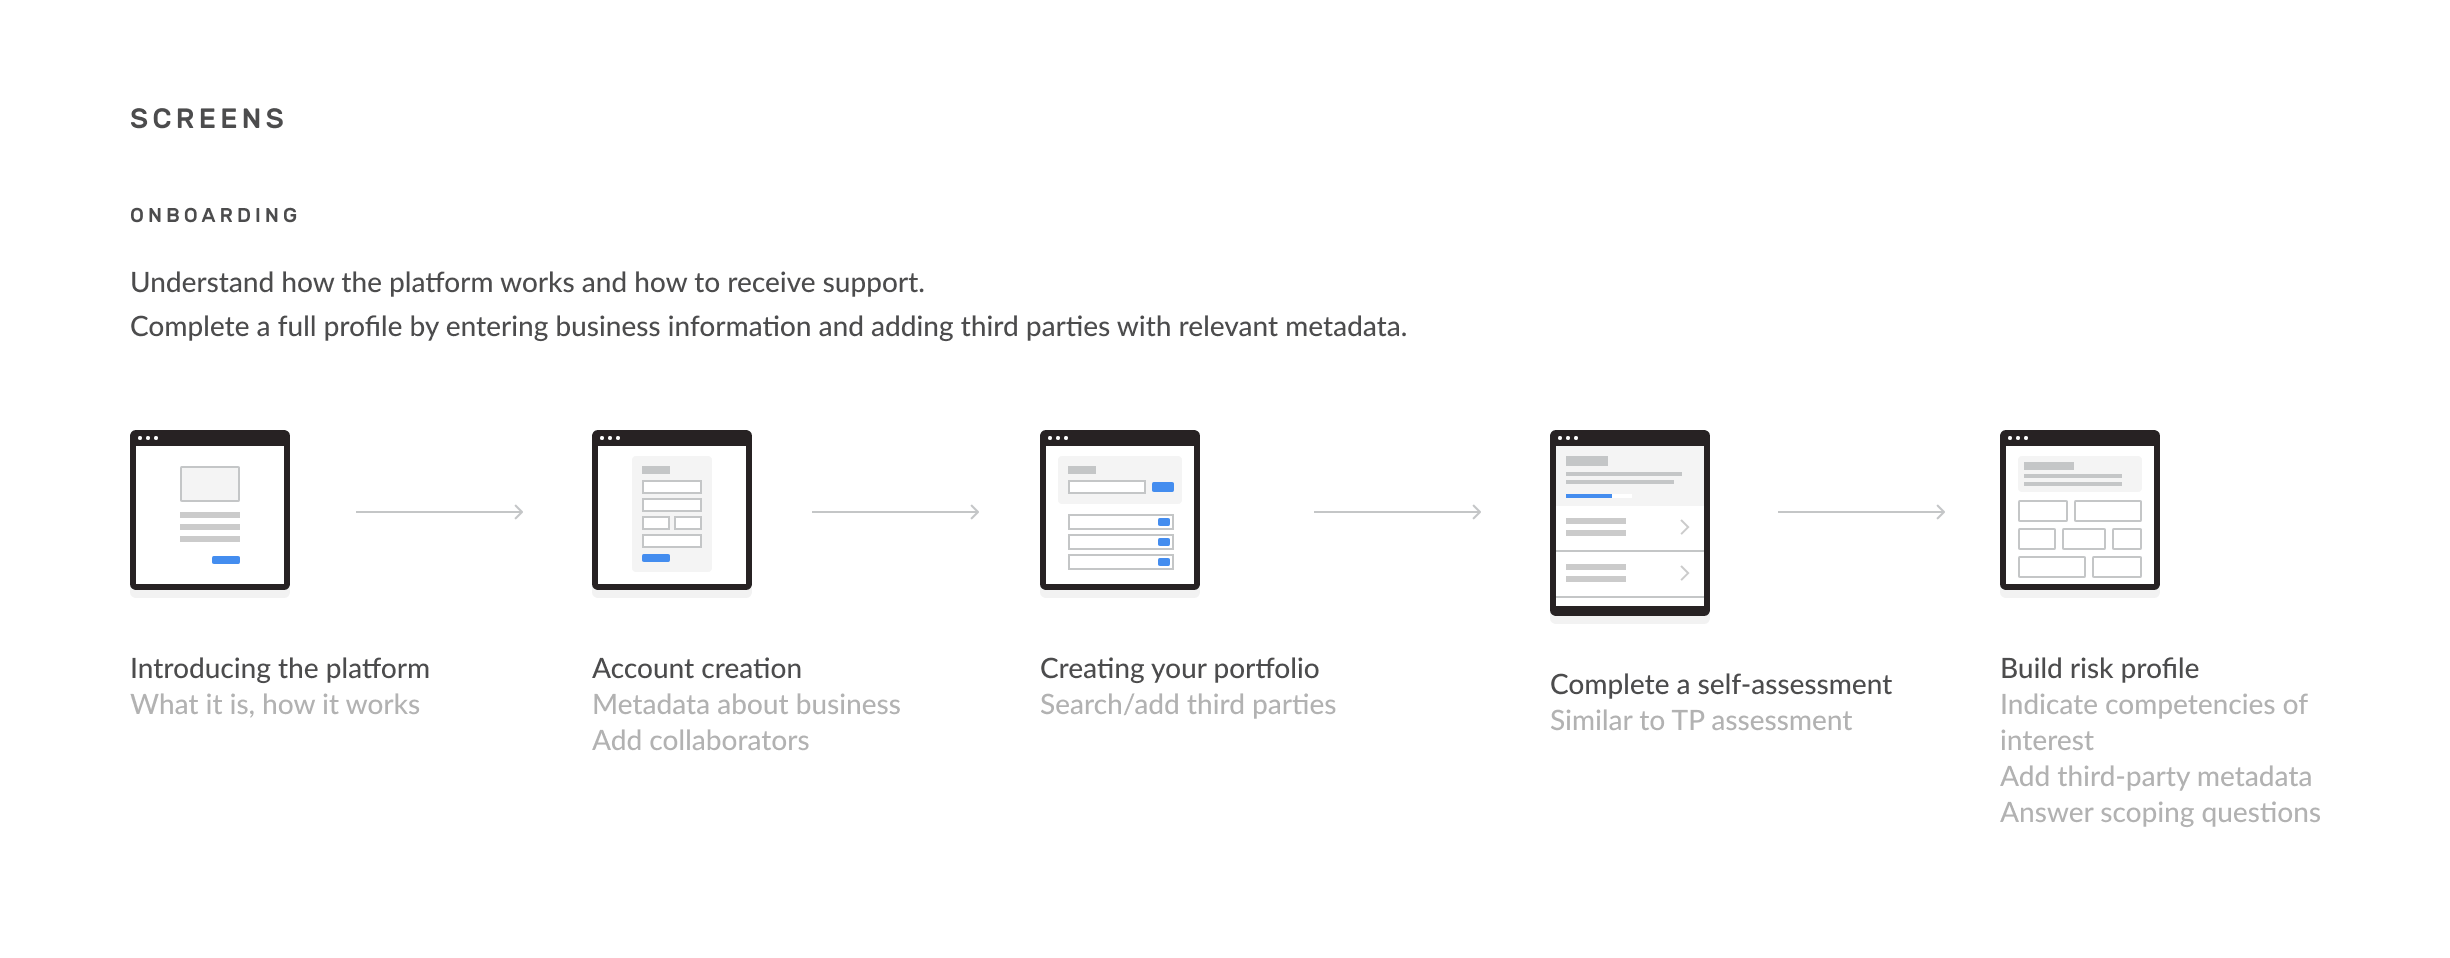
I started by documenting a number of user flows in the system, from onboarding to analysis to sharing data internally and with vendors.
Because each company studies its risk differently, we designed ways that let them easily flip between types of companies and types of risk. This allowed them to quickly view their data from multiple angles.
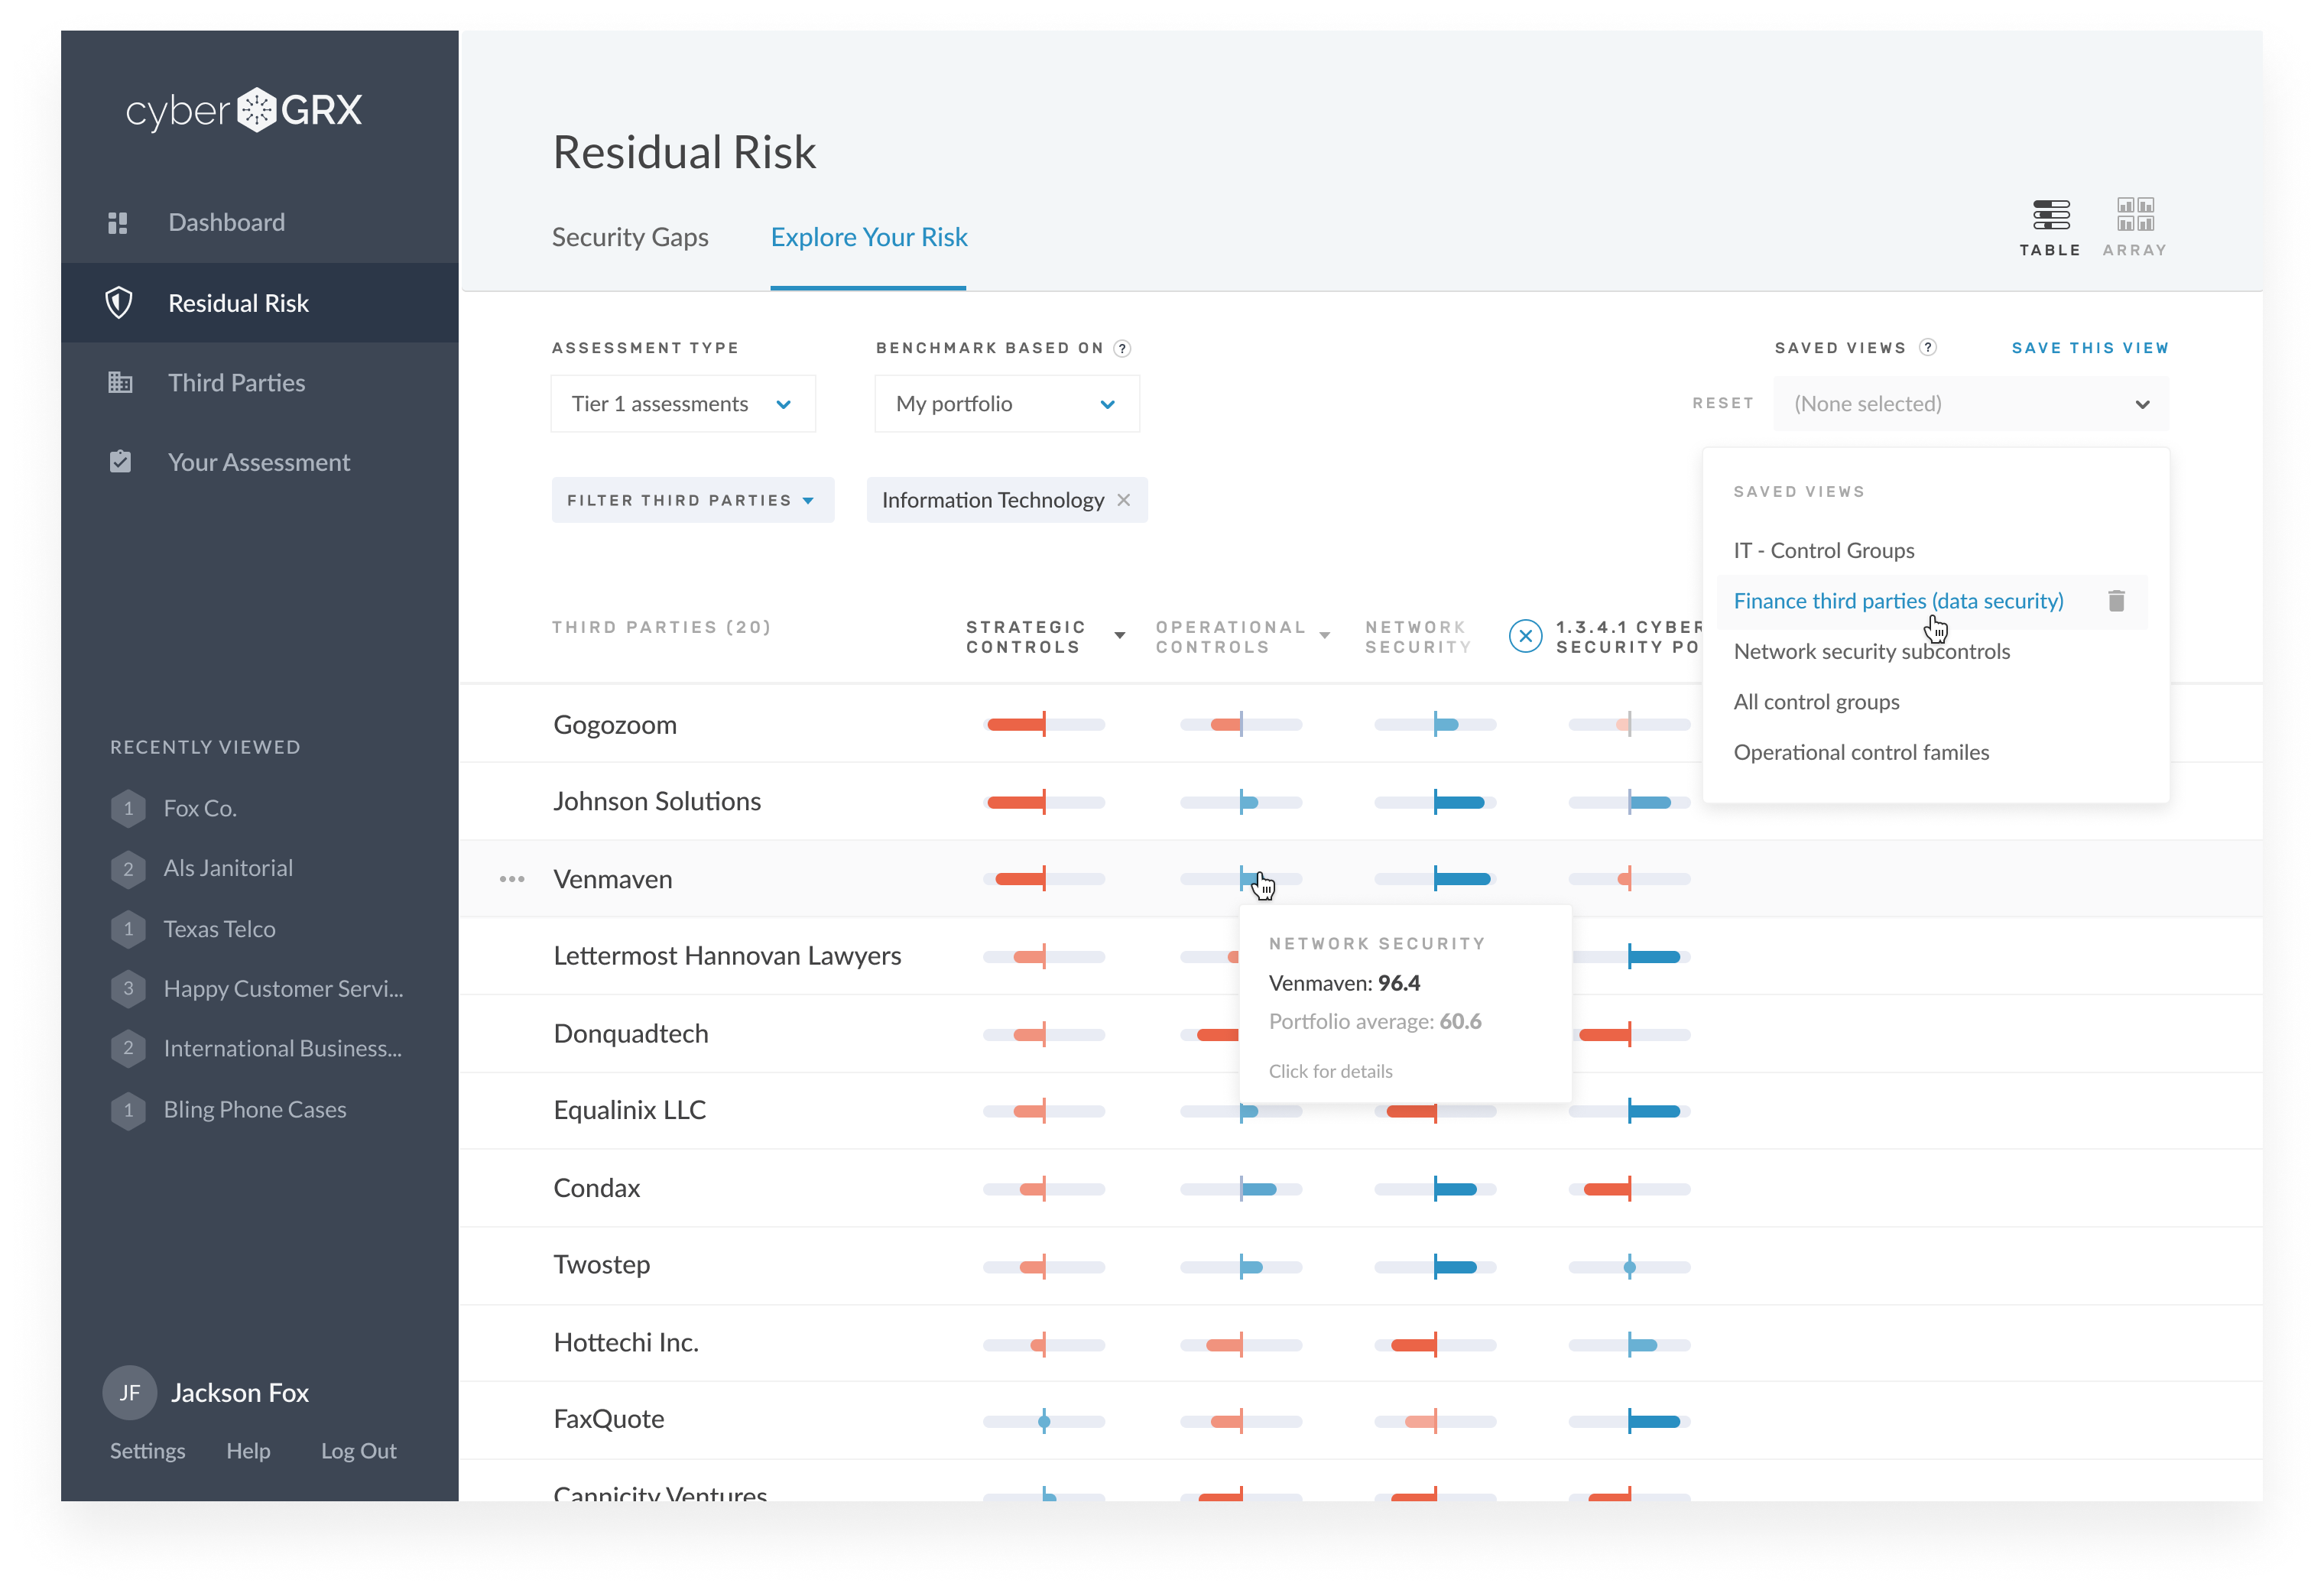
Bullet graphs are a straightforward way to show multiple comparisons to benchmarks in the same view. I reworked the traditional bullet graph design in order to show departures above and below profile averages.
I was careful to use color consistently across the interface, sticking to a limited palette so that people wouldn't have to learn new conventions for understanding the variety of visualizations.
Wrapping Up
Accounting for variability is the essential challenge of designing visualization-intensive digital products. It's one thing to come up with a graphic that works well for a static data set. But with dynamic data that varies from one account to the next, you can't predict how much or how little data any given user will see — or the distribution of that data. Designing useful graphics that could accomodate the variety of account types on the CyberGRX platform was challenging, and required iteration and usability testing.
I've come to realize that digital product design is essentially information design, whether or not an interface has data graphics or not. Digital design is the art of handling flux. It's what makes it unique, sometimes infuriating, always fascinating.
Takeaways
Start with the data. Before proposing any visualization patterns, I held interviews with cybersecurity subject matter experts to understand nuances of the data and how it was used in practice. This helped us avoid designing flashy graphics that were ultimately useless.
Understand happens through comparisons. It isn't enough to just show data points; any visualization has to help people answer the question, "Compared to what?" I explored different ways of facilitating comparisons against benchmarks and points in time to give context to what was being presented.
Avoid encoding data. It's tempting to use icons and legends when trying to clarify multifaceted data sets. Some abstraction is inevitable, yet encoding the data with patterns like these risks increasing readers' cognitive burden. I sought to create self-contained visualizations that could be understood at a glance without reference to additional explanations.